As a reporter, I have no standing in settling scientific disputes.
So, when Vinay Prasad and I hit the wall in our discussion of the assumptions he and a group of colleagues made in their provocative “thought experiment,” I decided to do what journals do—send the paper to peer reviewers.
My conversation with Prasad appears here.
The paper in question, “Low-value approvals and high prices might incentivize ineffective drug development” had been cited as a “study” in an editorial in The New York Times.
“Drug approval has become so lax and relatively inexpensive, one recent study suggested that companies could theoretically test compounds they know to be ineffective with the hope of getting a false positive result that would enable them to market a worthless medicine at an enormous profit,” the Times editorial states.
If this prospect is real, the world should know. If not, a corrigendum would be called for.
Clearly, the paper, published in Nature Reviews Clinical Oncology, was not a study. It was slugged “Comment.” The journal’s editors said to me that commentary is typically edited in-house.
It is not peer-reviewed by outside experts who have fluency in the subject area. So, peer review, albeit post-publication, would be the paper’s first.
When I approached potential reviewers, several of them cited concerns about being hounded on social media and agreed to participate on condition that their names would not be disclosed. I consulted an ethicist—Art Caplan, at NYU—who reaffirmed to me that this would be consistent with the way reviews are done at journals.
This is not exactly the same as a news publication relying on anonymous sources, which is something The Cancer Letter does on a case-by-case basis. Indeed, we have gone to court twice to protect confidentiality of our sources.
Confidentiality of review in science allows the authors’ scientific colleagues to rise above personalities and, freed from concerns about potential consequences, focus on the truth. Though some journals are starting to identify reviewers publicly, confidential review is still the norm.
Under normal circumstances, peer review is conducted in order to identify concerns and, ultimately, to determine whether a paper should be published. In this case, the goal is to establish publicly whether a provocative hypothesis advanced by the authors and amplified in the Times is, in fact, viable. This can be determined only by publishing the reviews.
The three reviewers were asked to assess the paper, and their reviews were sent to Prasad and his colleagues. The responses were signed by Prasad, a hematologist-oncologist at the Knight Cancer Institute at the Oregon Health Science University, and Christopher McCabe, executive director and CEO of the Institute for Health Economics in Edmonton, Canada.
After the authors responded, their responses were sent to one of the reviewers to determine whether the authors had addressed the issues.
“Thank you for the opportunity to respond to the post publication criticism of these anonymous people,” Prasad wrote to me after responding to the reviews. “The overall lesson here is that post publication comments are welcome and warranted. I urge these academics to blog, tweet or write letters and we will respond.”
He concluded with a smiley face emoji.
Does the hypothesis set forth in the Prasad et al. paper hold water?
Read on:
Reviewer 1
I have sympathy for the authors’ overall thesis that sky-high prices for oncology drugs creates incentives for drug development that may not be in the interest of either cancer patients or society as a whole. However, the authors’ specific statistical arguments about the minimum profit required to justify development of an ineffective drug are not supportable.
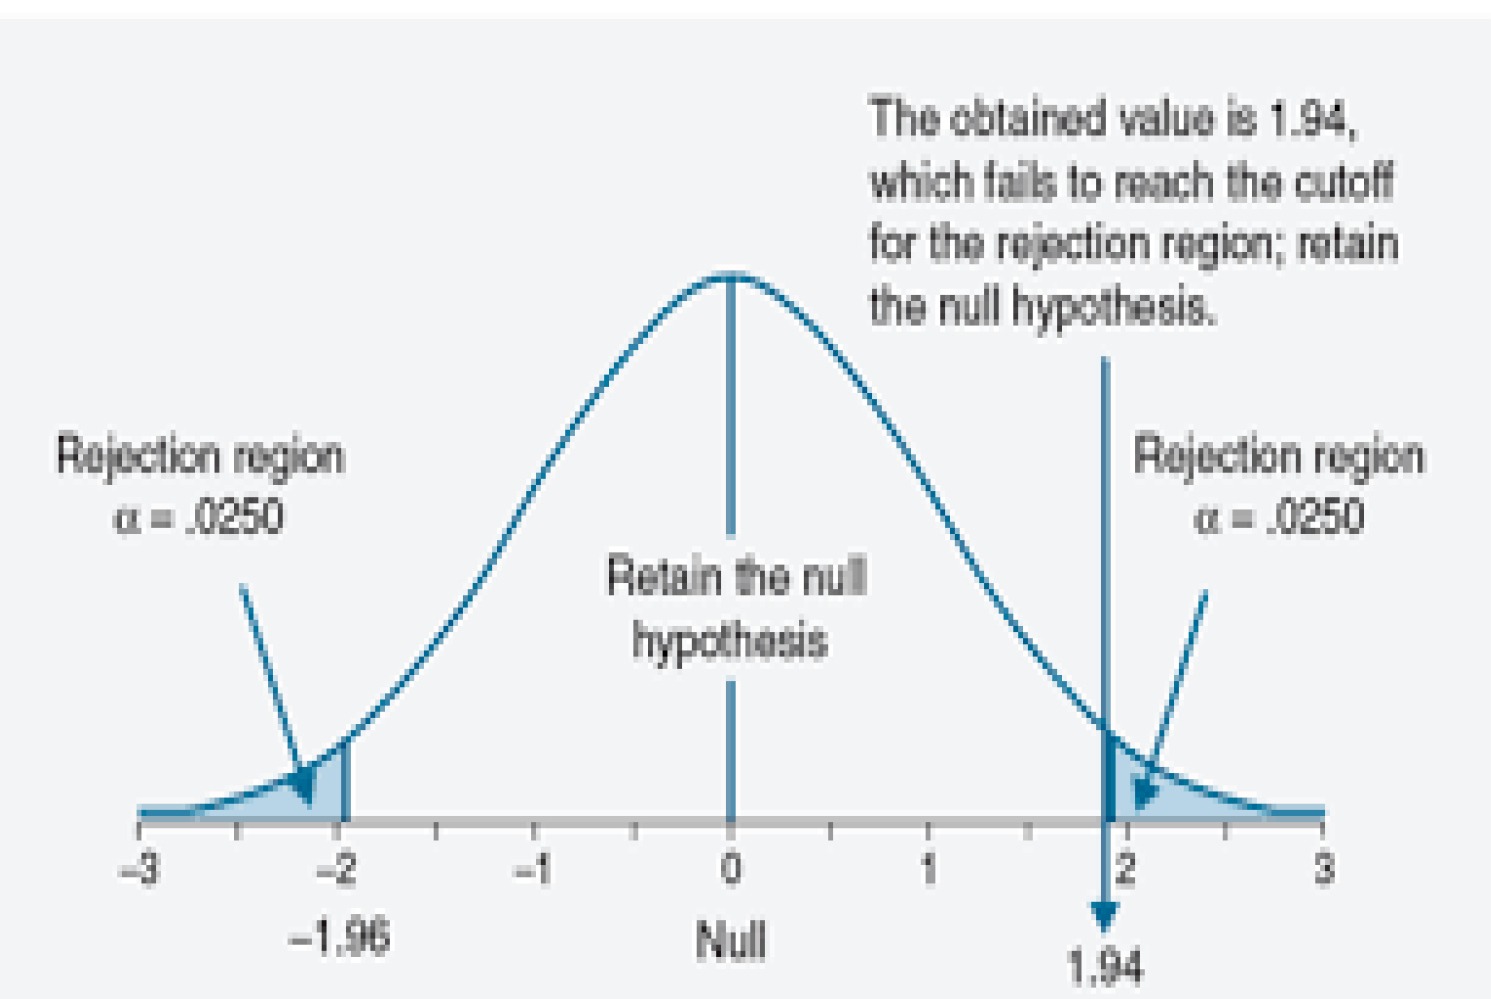
First, while it is true that 5 percent of trials of ineffective agents will reject the null hypothesis, half of those will favor the control group.
Second, phase III trials of completely novel agents without preceding phase II trials are almost unheard of. Yes, the phase III trial of everolimus for hepatocellular carcinoma was conducted without a prior phase II for this specific indication, but there had been numerous prior phase II trials of everolimus, dating back to 2009. Phase II trials typically use an alpha (p-value threshold) of 10 percent. The probability that an ineffective drug will be favored in a phase II and then a subsequent phase III is therefore 10% × 2.5% or 0.25%, 20-fold lower than the authors’ estimate.
Moreover, the authors’ estimate of minimum drug profit for an ineffective agent ignores the cost of either preclinical, phase I or phase II study. Even if we thought that such costs added a mere $5m, it is clear that the cited estimates are way off.
For instance: start with 400 ineffective drugs, 360 of which fail at phase II for a total cost of 360 × $5m = $1.8 billion; 40 phase III trials are then conducted at a total cost of $880m leading to one marketable drug. Drug profits would therefore need to be well-north of $2.5bn per drug to justify development of ineffective agents, about 6 -fold the authors’ estimate.
The statistical lesson to learn from all this is that p-values should not be viewed in isolation. We would indeed have a problem if the data requested by regulatory authorities consisted of a single number on a piece of paper, representing the p-value for the primary comparison in a randomized trial. But as we all know, submissions to agencies such as the FDA are fat documents including extensive preclinical and early clinical data, and exhaustive details on the randomized trial. Maybe we need more transparency about the criteria for drug approval and a suitable, informed debate might well be enlightening. Simplistic, headline grabbing arguments, on the other hand, are not of value.
Prasad and Christopher McCabe respond:
Thanks for the comments; I will argue the manuscript is not only supportable, but robust & strong. A clearer understanding of cancer trial development, that I will detail, leads to this conclusion.
In the paper, we note that p <0.05 would mean a false positive rate of 1 in 20. This is assuming the p-value is one-sided. The commentor feels that we should use two-sided p-value in which case the false positive rate would be 1 in 40 and our estimate would rise to $880 million break-even point.
Yet, in the paper we clearly use 1 tailed p-value: first we note that accepting a single trial with a p-value < 0.05 as the threshold of significance means that, if one ran 100 trials for which the null hypothesis were true (that the drug is ineffective), on average, 5 trials would produce false-positive ‘statistically significant’ results.
The commenter is correct that the above refers to a one-sided p-value. He is also correct that the FDA has required two-sided p-values for some approvals. There is no FDA standard for p-value, one-sided or two sided.
It is important to recognize that no law or regulation requires this (or any other specific) statistical standard to be applied to the analysis of clinical trials (although we have seen that the regulations require a quantitative comparison of the effects of the drug to those of a control group).
(citation)
There are examples for drugs approved based on trials with one-sided (citation) and two-sided p-values and there are examples of FDA approval with false positive rate of 1 in 20 or even higher 1 in 10. (citation)
We look at this paper/thought experiment as exactly that, a thought experiment: What are the potential consequences if the FDA were to be lax and lower regulatory threshold for approval such that drugs with a false positive rate of 1 in 20 or even higher are approved. It certainly does not claim that the FDA approves all drugs in this fashion, and it is clear that the FDA has been even more lax.
[You state]: “Second, phase III trials of completely novel agents without preceding phase II trials are almost unheard of. Yes, the phase III trial of everolimus for hepatocellular carcinoma was conducted without a prior phase II for this specific indication, but there had been numerous prior phase II trials of everolimus, dating back to 2014.”
This is not the right way to think about this. Drug makers have many compounds that have already passed through phase I and II testing, which may have little to no activity in other tumor types. They face the question of how many phase III trials or randomized P2 trials to run. This calculation balances the cost of running the trial, probability of success and expected return. This is what our paper models.
Moreover, there are many other examples of launching phase 3 in cancer medicine based on little early phase rationale. “Many recent phase III RCTs were initiated without sufficient evidence of activity from early-phase clinical trials.”
Kimmelman has shown that after a drug receives approval for one indication it is tested in broad sets of trials in many other tumor types (citation 1 and citation 2) and others have pointed to broad, duplicative portfolios of IO trials (citation) and (citation). It is with this background that we approach our question.
[You state]: “Phase II trials typically use an alpha (p-value threshold) of 10 percent. The probability that an ineffective drug will be favored in a phase II and then a subsequent phase III is therefore 10% × 2.5% or 0.25%, 20-fold lower than the authors’ estimate.”
It is simply not factually correct to argue that most phase III trials in oncology were preceded by randomized phase II trials with p-value of 0.1 threshold
From the Tannock paper above, “A recent review showed that a majority of phase II trials evaluating targeted agents are single-arm studies and that objective response rate (ORR), as used in most phase II trials evaluating chemotherapy, predicts (albeit imperfectly) eventual success in phase III trials (22).
However, ORRs in most phase III RCTs were lower than those in preceding phase II studies, with a mean absolute difference of 12.9 percent (23). There are examples of success with agents that showed a substantial and durable ORR in single-arm phase II trials, including some immunotherapeutic agents, and examples of failures despite showing improvement in OS in randomized phase II studies (24–26). In one analysis more complex randomized, double-blind, and multi-arm phase II trials did not translate to positive phase III RCTs more often than single-arm phase II studies (27).”
Moreover, another paper shows many p3 trials are launched with NEGATIVE or NO phase II at all. 6 percent of negative p3 preceded by no phase II 31 percent only inconclusive p2 and 18 percent a negative phase II study. (citation)
In short, the commentor is factually wrong. We wish we lived in a world where p3 were only launched after positive p2s (that were randomized).
[You state]: “Moreover, the authors’ estimate of minimum drug profit for an ineffective agent ignores the cost of either preclinical, phase I or phase II study. Even if we thought that such costs added a mere $5m, it is clear that the cited estimates are way off. For instance: start with 400 ineffective drugs, 360 of which fail at phase II for a total cost of 360 × $5m = $1.8bn; 40 phase III trials are then conducted at a total cost of $880m leading to one marketable drug. Drug profits would therefore need to be well-north of $2.5bn per drug to justify development of ineffective agents, about 6 -fold the authors’ estimate.”
These are sunk costs for our question of what p3 portfolio a company should run.
[You state]: “The statistical lesson to learn from all this is that p-values should not be viewed in isolation. We would indeed have a problem if the data requested by regulatory authorities consisted of a single number on a piece of paper, representing the p-value for the primary comparison in a randomized trial. But as we all know, submissions to agencies such as the FDA are fat documents including extensive preclinical and early clinical data, and exhaustive details on the randomized trial. Maybe we need more transparency about the criteria for drug approval and a suitable, informed debate might well be enlightening. Simplistic, headline grabbing arguments, on the other hand, are not of value.”
There is no dispute that the current regulatory system is not as bad as our thought experiment, and yet, as we show, the real world is likely not much better, and that is scary and notable. And the title of our paper was “Low-value approvals and high prices might incentivize ineffective drug development”, which is fair and accurate and not “headline grabbing”
Reviewer 2:
Thank you for the opportunity to read this paper. I focus just on what the authors term their ‘mathematical model’. The basic question the authors ask is whether the returns to a company from getting a drug approved are so great that under current cost of development and FDA approval standards, an approach of testing inert drugs would be expected to be profitable. Their answer is a resounding yes, but they seem to have made some problematic decisions that make their thesis more likely to be proven out than contradicted.
Here is the basic equation they are testing and I have labeled each of the components A, B, C
(A: Cost of doing a study) X (B: N of studies to find a lucky positive) < (C: Profits from lucky positive)
Now I will review the errors in each A, B, C.
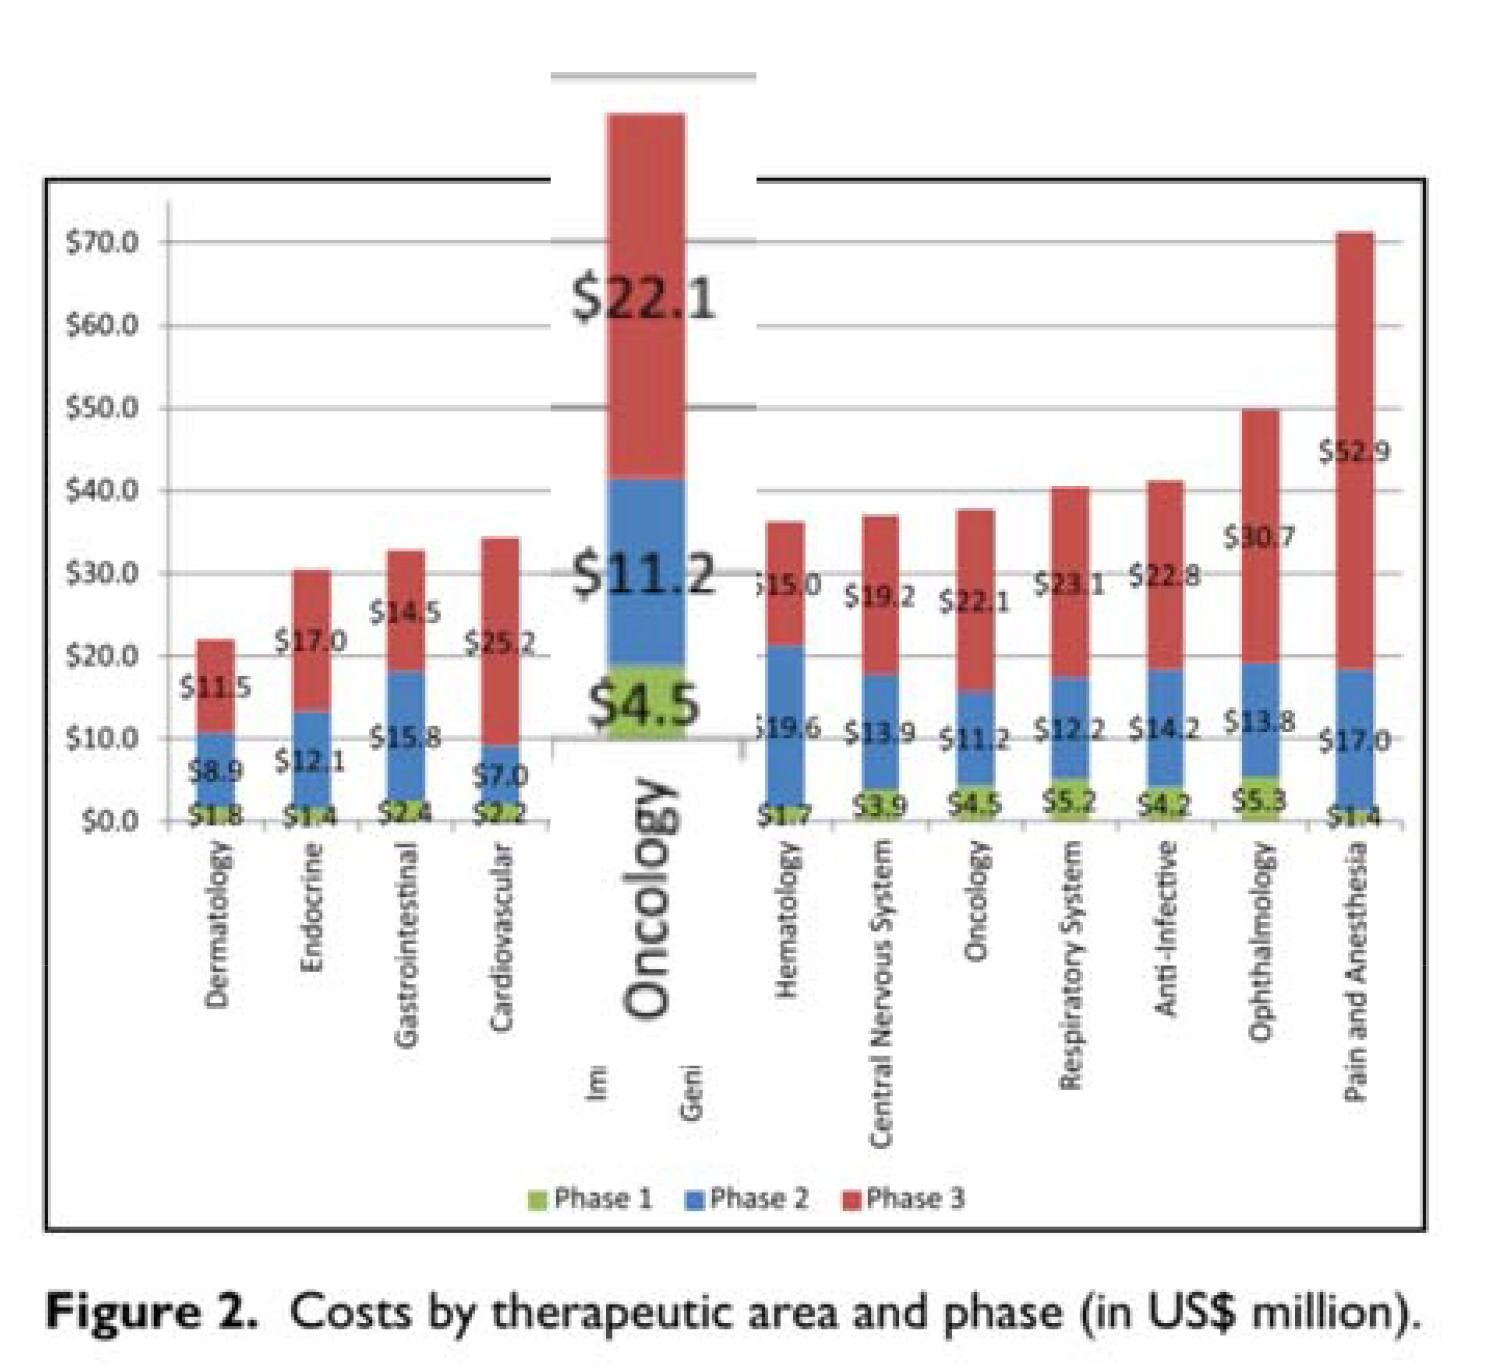
A – Cost of doing the study: The authors rely on a report from HHS on the cost of doing a trial presented for oncology and other specialties separately. The authors however only use the cost of the phase III testing of a compound ($22.1 million) even though the report includes the cost of phase I and phase II in the same Figure (right, which sum to $15.7). I see no reason (other than to lowball the cost of testing) to ignore the Phase I and II costs. Another smaller issue is the cost data (2004-2012) they use are older than the company revenue data (2006-2015) by about 3 years or so, and they do not adjust to the same dollar-year. This is a necessary step and would bring the two sides of the equation into alignment, for instance raising the value on the left-hand side by around 5 percent. The two fixes would make the A term about twice as large, or thereabouts but when I recalculate below I leave out the inflationary adjustment.
B – The authors are wrong on what the p< 0.05 reflects regarding how often a trial of an inert compound would be ‘positive’. They repeat this same error when they talk about the probability of having two falsely positive trials listing it as .05^N. They say one in twenty trials would by chance alone be ‘positive’. What they clearly mean is that one in twenty trials would show the inert compound to be superior to the comparator. This is a big oops. In testing the null, setting the P cutoff to 0.05 is equivalent to saying you would accept a ‘falsely significant’ finding (i.e. a Type 1 error) one in twenty times, but those occur half the time when the inert compound appears better than the comparator by chance, and half the time when the opposite is observed by chance. In other words, the B term is half the value it should be.
C – The authors mix up Revenues and Profits. In colloquial language, Revenues are what come in the door, Profits are left over after the company pays the expenses of bringing in those revenues, like paying for manufacturing, sales people, legal, and CEO compensation.
Here is an example of them mixing up the two terms from their opening explanation of their model:
Third, modern anticancer drugs are highly profitable. In an analysis of ten anticancer drugs that come to the market between 2006 and 2015, we calculated median post-approval revenues of $1.67 billion at a median of only 4 years after approval.
And here they are talking about how their model shows PROFITS are positive from this strategy:
In short, in the current system, pharmaceutical companies could, hypothetically, turn a profit by testing inert chemical compounds in phase III trials…
Here are some definitions from Investopedia:
“Revenue is the amount of money that a company actually receives during a specific period, including discounts and deductions for returned merchandise. It is the top line or gross income figure from which costs are subtracted to determine net income.”
“Profit is a financial benefit that is realized when the amount of revenue gained from a business activity exceeds the expenses, costs and taxes needed to sustain the activity. Any profit that is gained goes to the business’s owners, who may or may not decide to spend it on the business.”
In no industry are Revenues and Profits the same number (except a kid’s lemonade stand because the parents pick up all the expenses). The industry profit margin is around 30 percent for biotech and 25 percent for pharma (citation). Taking the higher, that changes their term C to 30 percent of 1.67 billion, or $500 Million.
Here is a quick adjustment of their ‘mathematical model’:
Their equation is:
(A: Cost of doing a study) X (B: N of studies to find a lucky positive) < (C: Profits from lucky positive)
Their values are:
$440 million ($22 million X 20 trials to find a lucky positive) < $1.67 billion, which is True.
Here are more appropriate values:
$1.56 Billion ($39 million x 40 trials) < $500 million, which is False.
Prasad and McCabe respond:
A – The commenter wants us to include phase I and 2 costs. However, as detailed in the prior comment, there is a reason not to include these costs. Drug companies are not running large portfolios of different chemicals, but rather dozens of RCTs of the same drugs, such as Avastin. Thus the early phase costs are sunk, and not relevant to our discussion.
B – The commenter wants us to use a 2 tailed p-value vs. 1 tailed. We clearly use 1 tailed. This is no “ooops” but an intentional decision to make the argument lucid and easy to follow. Moreover, I have already established that the FDA is EVEN MORE LAX with approvals, therefore the point is moot.
C – The commenter thinks we have overestimated drug company revenue from drugs, but is missing a major consideration. Drug companies earn $1.67 billion in revenue in the first 4 years after approval. Here is what is being forgotten. They have 14.3 (10 more) years on average of exclusivity to accrue further profits. (cite: Wang B, Liu J, Kesselheim AS. Variations in time of market exclusivity among top-selling prescription drugs in the United States. JAMA Intern Med. 2015;175(4):635-637.) Assuming no growth in market share (pessimistic outlook), that is 5. 4 billion in revenue. It is wrong to multiply this by the profit percent because we are subtracting p3 R&D outlay from the total revenue.
The profit is the balance of the revenue from running an ineffective trial portfolio and the cost.
Moreover, you don’t need to depend on this one study. It is well recognized that cancer drugs earn billions of dollars annually (citation) not to mention far more over their exclusivity period.
Reviewer 3
The hypothesis is a drug company could launch many trials with little chance of achieving success and come out with a profit because one in 20 trials will be a false positive finding.
I am concerned that there is a bit of exaggeration in the paper while there are some legitimate points.
The new definition of cancer using genomics is making many organ cancers into orphan diseases. There are multiple types of adenocarcinoma of the lung, for example.
The FDA realizing that large phase III studies are not possible is accepting small statistically significant improvement observed in single trials as data for approval. In some cases, these studies are not even randomized. This brings up the questions of confidence in surrogate endpoints as well as confidence in the finding from a single trial.
Accepting a single trial with a p-value <.05 means there is less than a 5 percent probability the finding is wrong due to chance. It is not a 5 percent chance the drug is ineffective or there is a false positive. These are slightly different things that I believe the author’s confuse. I am also concerned that lumping 100 trials of different drugs, each with a p<0.05 and assuming five findings will be wrong is inappropriate.
I am sure that assuming five findings will be a false positive is a stretch.
In statements about the cost of drug development and the money made selling an approved drug:
I worry the authors confuse a drug company’s revenue with a drug company’s profit.
I do note a single phase III trial is estimated to cost 22.1 million dollars in what year? The cost to a drug company for drug development is not just the phase III costs. Is it appropriate to say these costs are “sunk?”
The point that low value redundant trials consume a lot of patients, and patients are a valuable commodity is accurate and has been made before.
The original hypothesis may be a stretch, but I do think the argument could be made that a drug company could make money by producing many drugs that have minimal improvement over previous drugs if high prices are charged.
This would protect the drug company from the high investment cost of developing drugs with newer unique mechanisms of action that are more likely to move the needle in terms of effectiveness. In one sobering study, only 19 percent of cancer drugs recently approved by the FDA met the ASCO definition of clinically meaningful survival outcomes.
In an effort to inform the conversation regarding value and outcomes ASCO published a perspective entitled “Raising the Bar for Clinical Trials by Defining Clinically Meaningful Outcomes.” Ellis LM, Bernstein DS, Voest EE, et al. J Clin Oncol. 2014;32: 1277-1280.
Prasad and McCabe respond:
[You state]: “The hypothesis is a drug company could launch many trials with little chance of achieving success and come out with a profit because one in 20 trials will be a false positive finding. I am concerned that there is a bit of exaggeration in the paper while there are some legitimate points.”
Well, we are careful to say, “We certainly do not believe that pharmaceutical companies are actively pursuing ineffective drugs, although the current oncology drug development and regulatory environment does little to discourage such an agenda.”
[You state]: “The new definition of cancer using genomics is making many organ cancers into orphan diseases. There are multiple types of adenocarcinoma of the lung, for example. The FDA realizing that large phase 3 studies are not possible is accepting small statistically significant improvement observed in single trials as data for approval. In some cases, these studies are not even randomized. This brings up the questions of confidence in surrogate endpoints as well as confidence in the finding from a single trial.”
This is a fine point, but tangential to our paper. Prasad has extensively studied surrogate endpoints in oncology, see here, and related papers. (citation)
[You state]: “Accepting a single trial with a p-value <.05 means there is less than a 5 percent probability the finding is wrong due to chance. It is not a 5 percent chance the drug is ineffective or there is a false positive. These are slightly different things that I believe the author’s confuse.”
I think the commenter is muddying the water. Accepting a 1 tailed p-value of <0.05 means that if you ran 100 inert compounds in RCTs of this size and duration, 5/100 would be positive by chance alone. None of the other commenters dispute this. The p-value is the probability the observed results or more extreme results would have occurred under the null hypothesis. One tailed v two tailed has been the bulk of the dispute.
Ioannidis explains: “Multiple misinterpretations of p-values exist, but the most common one is that they represent the “probability that the studied hypothesis is true.”3 A p-value of .02 (2 percent) is wrongly considered to mean that the null hypothesis (e.g., the drug is as effective as placebo) is 2 percent likely to be true and the alternative (e.g., the drug is more effective than placebo) is 98 percent likely to be correct.” (citation)
[You state]: “I am also concerned that lumping 100 trials of different drugs, each with a p<0.05 and assuming 5 findings will be wrong is inappropriate. I am sure that assuming 5 findings will be a false positive is a stretch.”
This concern is unfounded. If you run 100 RCTs of inert compounds per our thought experiment, five will be false positive results with a one tailed p of 0.05. None of the other commenters dispute this, they merely prefer a 2 tailed calculation. Finally, the real FDA is more lax than either standard, thus our argument stands.
[You state]: “In statements about the cost of drug development and the money made selling an approved drug. I worry the authors confuse a drug company’s revenue with a drug company’s profit.”
We mean that the revenue per success justifies the portfolio, and explain above.
[You state]: “I do note a single phase 3 trial is estimated to cost 22.1 million dollars in what year?”
This is based on an HHS report published in 2016. Others may choose alternate figures.
[You state]: “The cost to a drug company for drug development is not just the phase 3 costs. Is it appropriate to say these costs are ‘sunk’?”
Yes, it is appropriate to say that.
[You state]: “The point that low value redundant trials consume a lot of patients, and patients are a valuable commodity is accurate and has been made before.”
Glad we agree.
[You state]: “The original hypothesis may be a stretch, but I do think the argument could be made that a drug company could make money by producing many drugs that have minimal improvement over previous drugs if high prices are charged. This would protect the drug company from the high investment cost of developing drugs with newer unique mechanisms of action that are more likely to move the needle in terms of effectiveness.”
No disagreement. The original hypothesis is a worst case scenario and nevertheless likely to be true, and this corollary, which is closer to the real world, is almost surely true.
[You state]: “In one sobering study, only 19 percent of cancer drugs recently approved by the FDA met the ASCO definition of clinically meaningful survival outcomes. In an effort to inform the conversation regarding value and outcomes ASCO published a perspective entitled “Raising the Bar for Clinical Trials by Defining Clinically Meaningful Outcomes.” Ellis LM, Bernstein DS, Voest EE, et al. J Clin Oncol. 2014;32: 1277-1280.”
We are well aware of these data, and they support our thesis.
Reviewer 2 responds to all comments by the authors:
I have reviewed the authors’ responses, and they are in many cases incomplete.
In response to all three reviewers noting that they had made an error regarding how many trials would be falsely positive based on a p-value < 0.05, the authors now state that they meant a one-sided p-value of < 0.05. I see nowhere that this unusual choice was clarified in their paper, and there is no debate that p-values at the 0.05 level are conventionally two sided. The authors say they clarified that they used a one-side p-value by saying that 5 out of 100 trials would be falsely positive in their analysis.
An alternative read of this sentence is they made an error in the first instance in understanding the p-value distribution, and simply restated their error using 5 in 100. It is sort as if someone submitted paper claiming that 7+1 = 10, and all reviewers said that in fact they sum to 8, and the authors say ‘we expect our readers to know we are writing in Base 8.’
One of the authors’ justifications of their unusual one-sided p-value is the claim it makes the paper more lucid and easy to follow. I would think using conventional p-values would be more in keeping with that objective, and I do not think 1 in 40 false positives is any harder to follow than 1 in 20 false positives.
But it is clear that the one-sided p-value works in favor of their hypothesis.
In order to justify excluding the costs of phase I and 2 studies the authors say now they are focusing just to those companies with existing vast portfolios of compounds that have passed through early testing, and so they can ignore the costs those companies took to get to that point.
This proposed business plan would not get far in any first-year class, portfolios of tested compounds do not just fall out of the sky. If the authors are serious about evaluating a business model of testing inert compounds, they need to account for the cost of getting those inert compounds to the point of testing.
Perhaps by coincidence, perhaps not, assuming earlier phases are costless works in favor of the authors’ hypothesis.
The authors do not address why they mistook revenues for profits. They seem to say that basically the two are the same, which is false. Their argument here is that profits are simply leftovers from revenues after accounting for the cost of phase 3 trials.
I am sure many pharmaceutical CEO’s would be ecstatic if that were anywhere close to correct. Industry wide, the average cost per dollar of revenue is between $.70 to $.75. This means for each dollar in sales the company ‘keeps’ $0.25 to $0.30. Industry average costs on R&D are only $0.16, there are a lot of other costs. Netting out R&D in the most optimistic case would make the profit margin 36 percent, reducing their 1.67 billion to $600 million, and in fact because the authors would not net out the cost of earlier testing the $600 million is on the high side.
Here, too, mistaking revenues for profits favors the authors’ hypothesis.


